In-band Network Telemetry (INT)
Overview
SD-Fabric supports the Inband Network Telemetry (INT) standard for data plane telemetry.
When INT is enabled, all switches are instrumented to generate INT reports for all traffic, reporting per-packet metadata such as the switch ID, ingress/egress ports, latency, queue congestion status, etc. Report generation is handled entirely at the data plane, in a way that does not affect the performance observed by regular traffic.
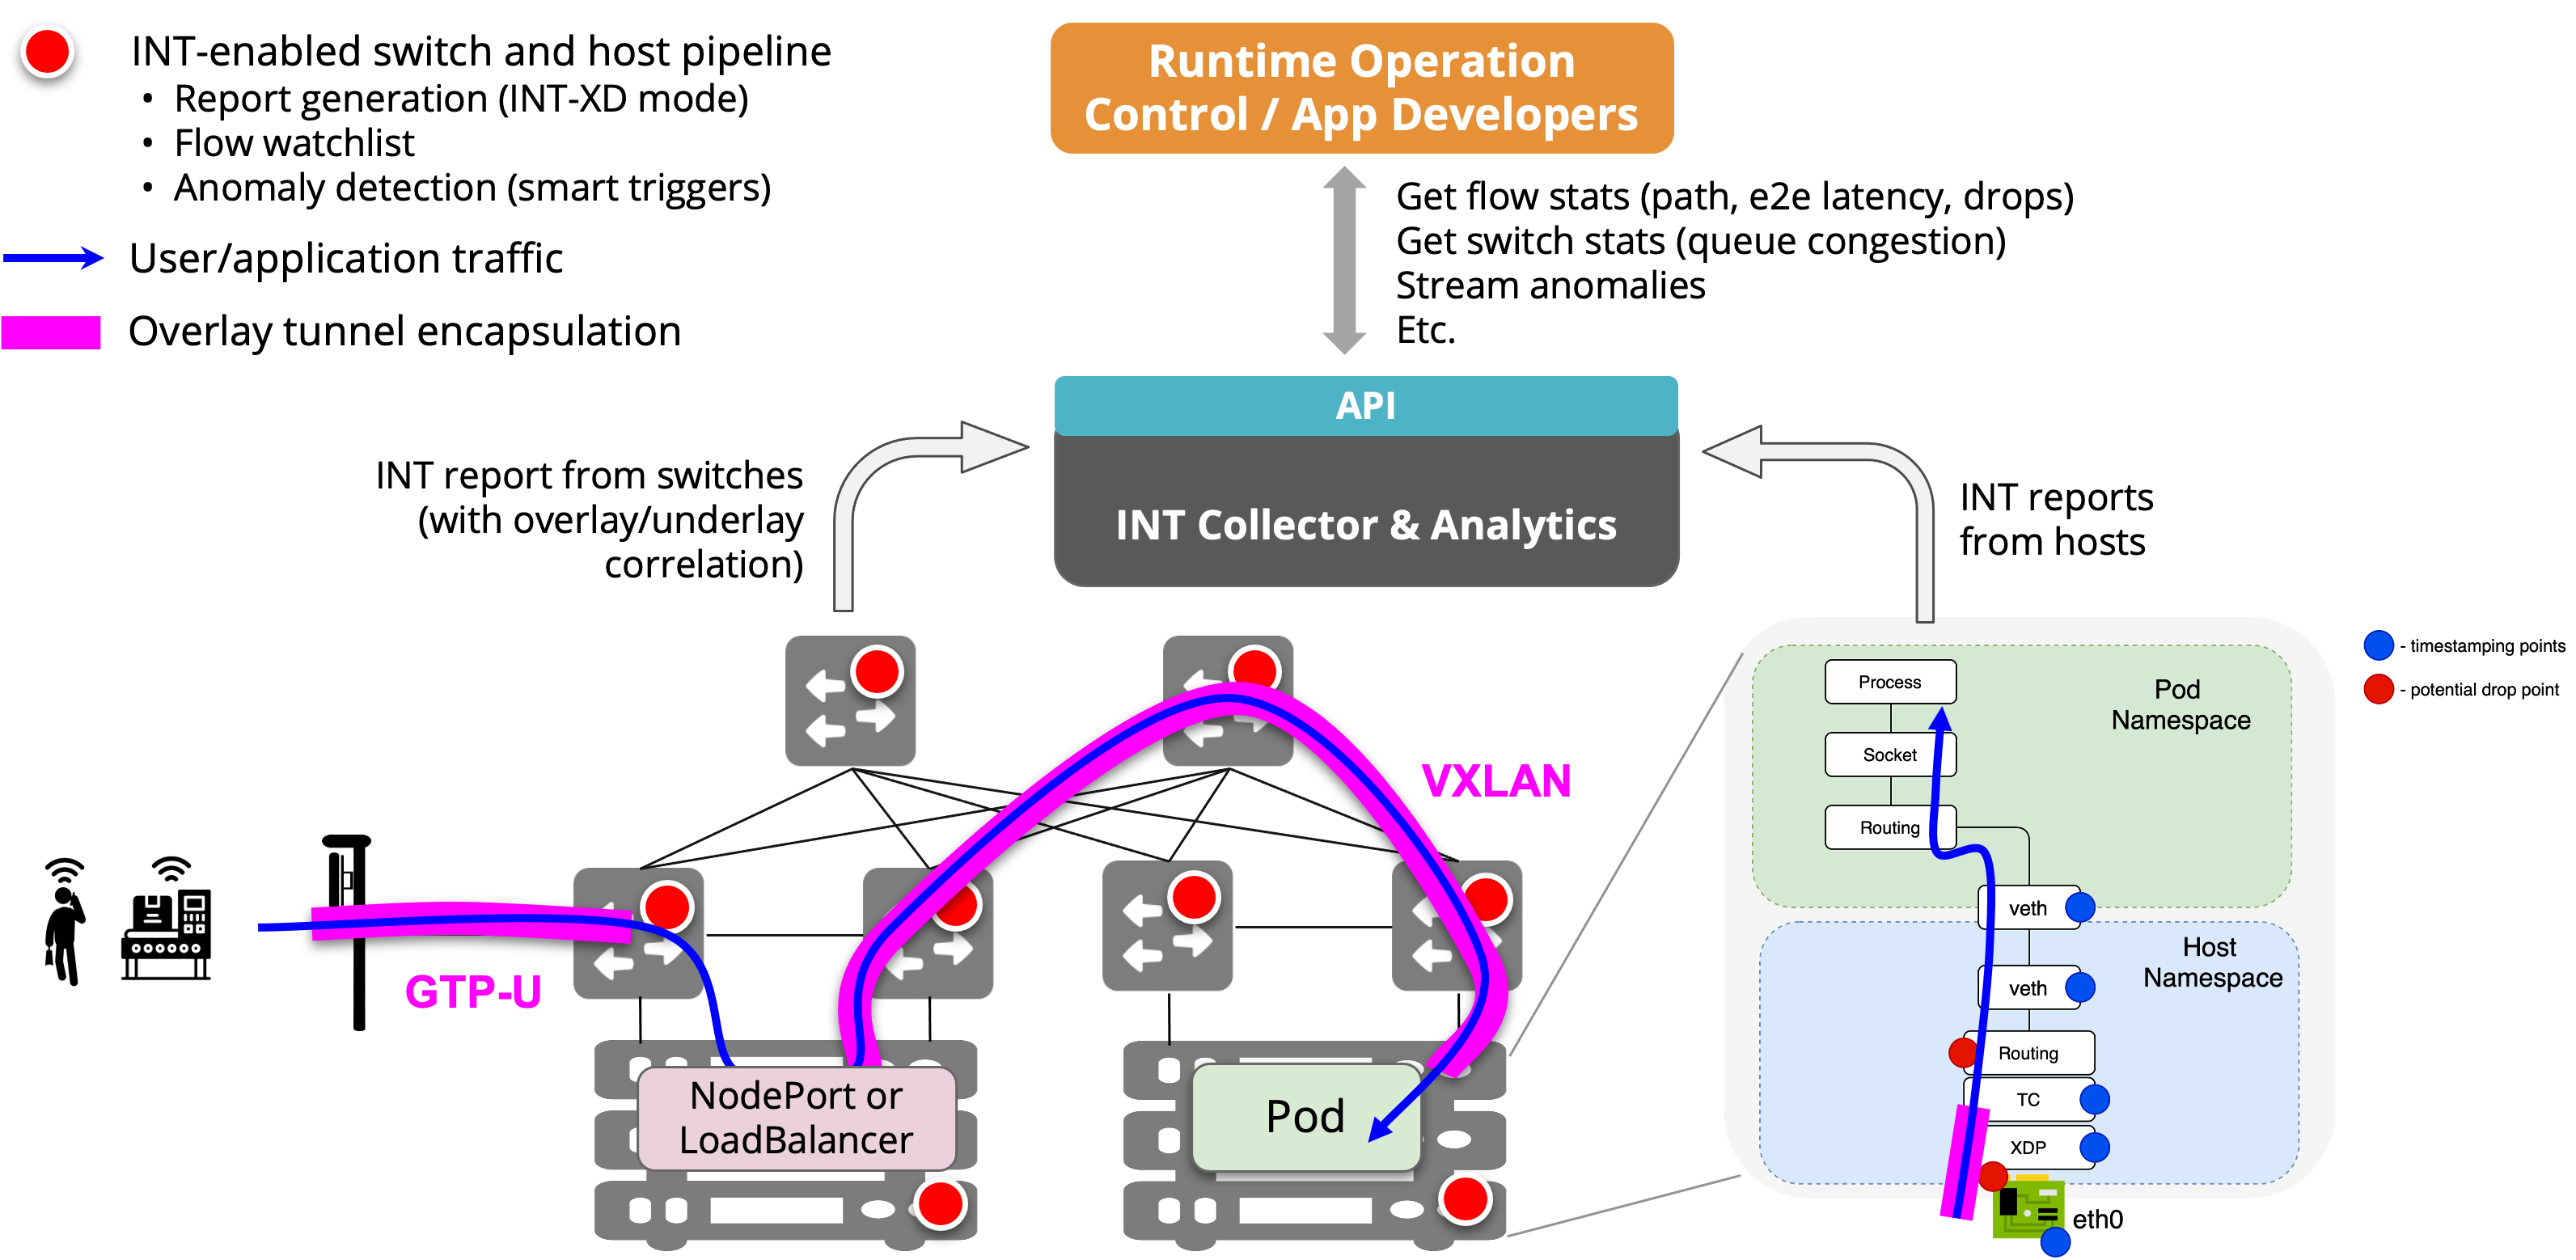
We aim at achieving visibility end-to-end. For this reason, we provide an implementation of INT for switches as well hosts. For switches, INT report generation is integrated as part of the same P4 pipeline responsible for bridging, routing, UPF, etc. For hosts, we provide experimental support for an eBPF-based application that can monitor packets as they are processed by the Kernel networking stack and Kubernetes CNI plug-ins. In the following, we use the term INT nodes to refer to both switches and hosts.
SD-Fabric is responsible for producing and delivering INT report packets to an external collector. The actual collection and analysis of reports is out of scope, but we support integration with 3rd party analytics platforms. SD-Fabric is currently being validated for integration with IntelTM DeepInsight, a commercial analytics platform. However, any collector compatible with the INT standard can be used instead.
Supported Features
Telemetry Report Format Specification v0.5: report packets generated by nodes adhere to this version of the standard.
INT-XD mode (eXport Data): all nodes generate “postcards”. For a given packet, the INT collector might receive up to N reports where N is the number of INT nodes in the path.
Configurable watchlist: specify which flows to monitor. It could be all traffic, entire subnets, or specific 5-tuples.
Flow reports: for a given flow (5-tuple), each node produces reports periodically allowing a collector to monitor the path and end-to-end latency, as well as detect anomalies such as path loop/change.
Drop reports: when a node drops a packet, it generates a report carrying the switch ID and the drop reason (e.g., routing table miss, TTL zero, queue congestion, and more).
Queue congestion reports: when queue utilization goes above a configurable threshold, switches produce reports for all packets in the queue, making it possible to identify exactly which flow is causing congestion.
Smart filters and triggers: generating INT reports for each packet seen by a node can lead to excessive network overhead and overloading at the collector. For this reason, nodes implement logic to limit the volume of reports generated in a way that doesn’t cause anomalies to go undetected. For flow reports and drop reports, the pipeline generates 1 report/sec for each 5-tuple, or more when detecting anomalies (e.g., changes in the ingress/egress port, queues, hop latency, etc). For queue congestion reports, the number of reports that can be generated for each congestion event is limited to a configurable “quota”.
Integration with P4-UPF: when processing GTP-U encapsulated packets, switches can watch inside GTP-U tunnels, generating reports for the inner headers and making it possible to troubleshoot issues at the application level. In addition, when generating drop reports, we support UPF-specific drop reasons to identify if drops are caused by the UPF tables (because of a misconfiguration somewhere in the control stack, or simply because the specific user device is not authorized).
INT Report Delivery
INT reports generated by nodes are delivered to the INT collector using the same fabric links. In the example below, user traffic goes through three switches. Each one is generating an INT report packet (postcard), which is forwarded using the same flow rules for regular traffic.
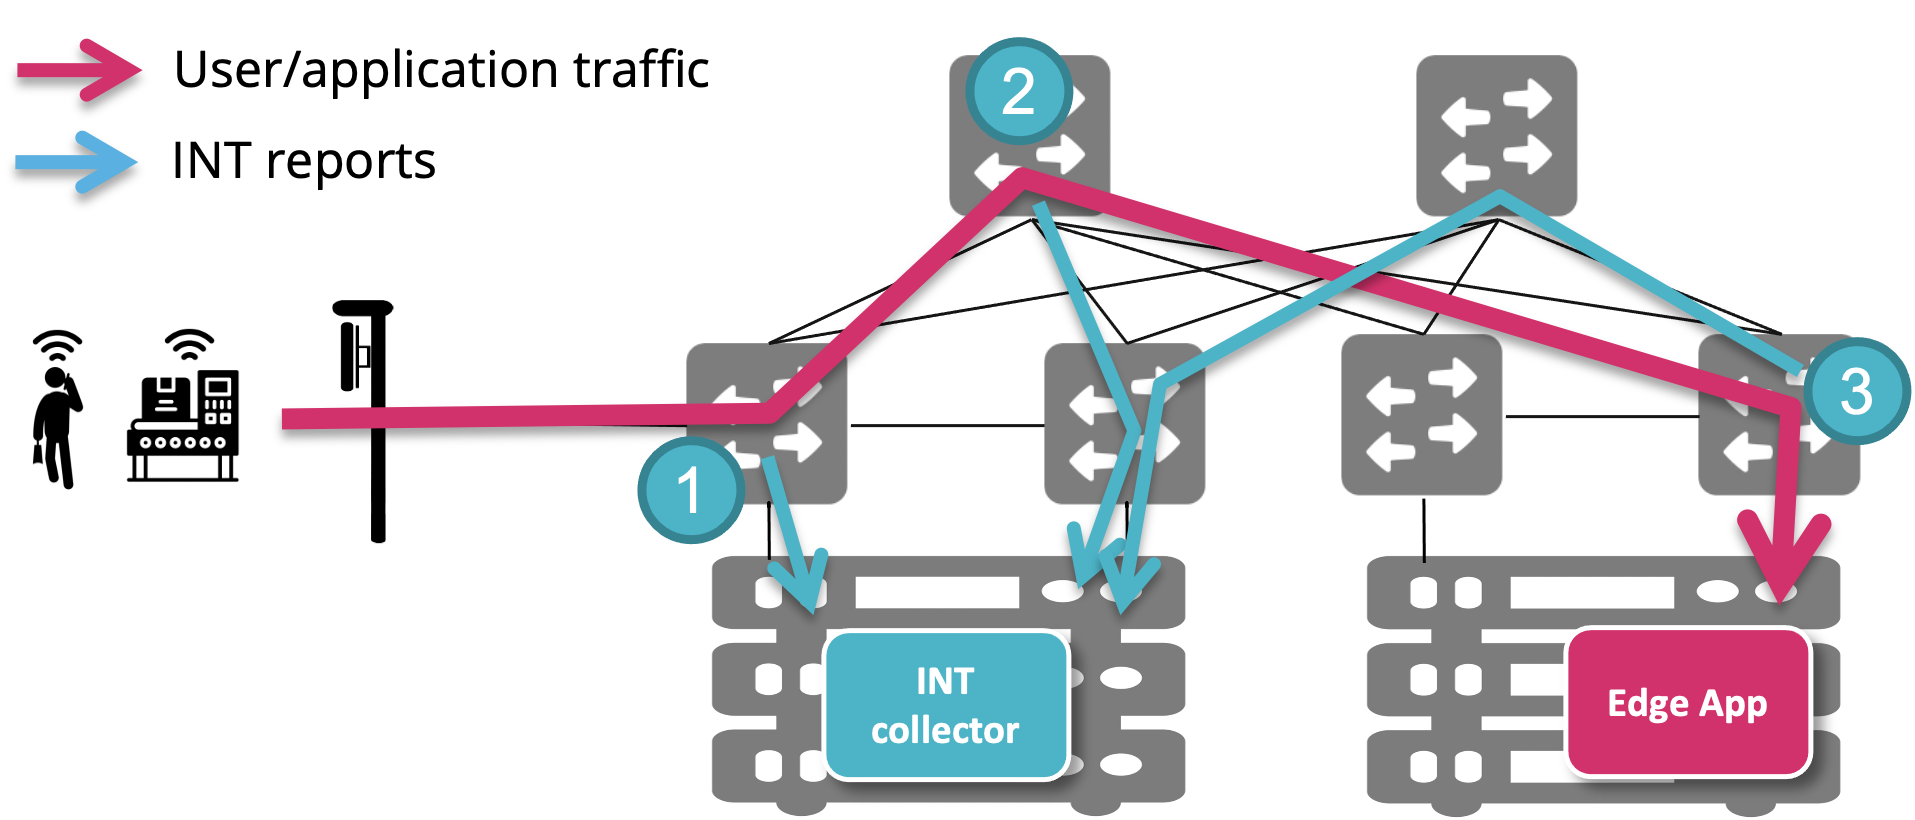
This choice has the advantage of simplifying deployment and control plane logic, as it doesn’t require setting up a different network and handling installation of flow rules specific to INT reports. However, the downside is that delivery of INT reports can be subject to the same issues that we are trying to detect using INT. For example, if a user packet is getting dropped because of missing routing entries, the INT report generated for the drop event might also be dropped for the same reason.
In future releases, we might add support for using the management network for report delivery, but for now using the fabric network is the only supported option.
ONOS Configuration
To enable INT, modify the ONOS netcfg in the following way:
in the
devicessection, use an INT-enabled pipeconf ID (fabric-intorfabric-spgw-int);in the
appssection, add a config block for app IDorg.stratumproject.fabric.tna.inbandtelemetry, like in the example below:
{
    "apps": {
        "org.stratumproject.fabric.tna.inbandtelemetry": {
            "report": {
                "collectorIp": "10.32.11.2",
                "collectorPort": 32766,
                "minFlowHopLatencyChangeNs": 256,
                "watchSubnets": [
                    "10.32.11.0/24"
                ],
                "queueReportLatencyThresholds": {
                    "0": {"triggerNs": 2000, "resetNs": 500},
                    "2": {"triggerNs": 1000, "resetNs": 400}
                }
            }
        }
    }
}
Here’s a reference of the fields that you can configure for the INT app:
collectorIp: The IP address of the INT collector. Must be an IP address routable by the fabric, either the IP address of a host directly connected to the fabric and discovered by ONOS, or reachable via an external router. RequiredcollectorPort: The UDP port used by the INT collector to listen for report packets. RequiredminFlowHopLatencyChangeNs: Minimum latency difference in nanoseconds to trigger flow report generation. Optional, default is 256.Used by the smart filters to immediately report abnormal latency changes. In normal conditions, switches generate 1 report per second for each active 5-tuple. During congestion, when packets experience higher latency, the switch will generate a report immediately if the latency difference between this packet and the previous one of the same 5-tuple is greater than
minFlowHopLatencyChangeNs.Warning: Setting
minFlowHopLatencyChangeNsto0or small values (lower than the switch normal jitter) will cause the switch to generate a lot of reports. The current implementation only supports powers of 2.watchSubnets: List of IPv4 prefixes to add to the watchlist. Optional, default is an empty list.All traffic with source or destination IPv4 address included in one of these prefixes will be reported (both flow and drop reports). All other packets will be ignored. To watch all traffic, use
0.0.0.0/0. For GTP-U encapsulated traffic, the watchlist is always applied to the inner headers. Hence to monitor UE traffic, you should provide the UE subnet.INT traffic is always excluded from the watchlist.
The default value (empty list) implies that flow reports and drop reports are disabled.
queueReportLatencyThresholds: A map specifying latency thresholds to trigger queue reports or reset the queue report quota. Optional, default is an empty map.The key of this map is the queue ID. Switches will generate queue congestion reports only for queue IDs in this map. Congestion detection for other queues is disabled. The same thresholds are used for all devices, i.e., it’s not possible to configure different thresholds for the same queue on different devices.
The value of this map is a tuple:
triggerNs: The latency threshold in nanoseconds to trigger queue reports. Once a packet experiences latency above this threshold, all subsequent packets in the same queue will be reported, independently of the watchlist, up to the quota or until latency drops belowtriggerNs. RequiredresetNs: The latency threshold in nanosecond to reset the quota. When packet latency goes below this threshold, the quota is reset to its original non-zero value. Optional, default is triggerNs/2.
Currently the default quota is 1024 and cannot be configured.
IntelTM DeepInsight Integration
Note
In this section, we assume that you already know how to deploy DeepInsight to your Kubernetes cluster with a valid license. For more information please reach out to Intel’s support.
To be able to use DeepInsight with SD-Fabric, use the following steps:
Modify the DeepInsight Helm Chart values.yml to include the following setting for tos_mask:
global:
  preprocessor:
    params:
      tos_mask: 0
Deploy DeepInsight
Obtain the IPv4 address of the fabric-facing NIC interface of the Kubernetes node where the
preprocessorcontainer is deployed. This is the address to use as thecollectorIpin the ONOS netcfg. This address must be routable by the fabric, i.e., make sure you can ping that from any other host in the fabric. Similarly, from within the preprocessor container you should be able to ping the loopback IPv4 address of all fabric switches (ipv4Loopbackin the ONOS netcfg). If ping doesn’t work, check the server’s RPF configuration, we recommend setting it tonet.ipv4.conf.all.rp_filter=2.Generate a
topology.jsonusing the SD-Fabric utility scripts (includes instructions) and upload it using the DeepInsight UI. Make sure to update and re-upload thetopology.jsonfrequently if you modify the network configuration in ONOS (e.g., if you add/remove switches or links, static routes, new hosts are discovered, etc.).
Enabling Host-INT
Support for INT on hosts is still experimental.
Please check the documentation here to install int-host-reporter on your
servers:
https://github.com/opennetworkinglab/int-host-reporter
Drop Reasons
We use the following reason codes when generating drop reports. Please use this table as a reference when debugging drop reasons in DeepInsight or other INT collector.
Code |
Name |
Description |
|---|---|---|
0 |
UNKNOWN |
Drop with unknown reason. |
26 |
IP TTL ZERO |
IPv4 or IPv6 TTL zero. There might be a forwarding loop. |
29 |
IP MISS |
IPv4 or IPv6 routing table miss. Check for missing routes in ONOS or if the host is discovered. |
55 |
INGRESS PORT VLAN MAPPING MISS |
Ingress port VLAN table miss. Packets are being received with an
unexpected VLAN. Check the |
71 |
TRAFFIC MANAGER |
Packet dropped by traffic manager due to congestion (tail drop) or because the port is down. |
80 |
ACL DENY |
Check the ACL table rules. |
89 |
BRIDGING MISS |
Missing bridging entry. Check table entry from bridging table. |
128 (WIP) |
NEXT ID MISS |
Missing next ID from ECMP ( |
129 |
MPLS MISS |
MPLS table miss. Check the segment routing device config in the netcfg. |
130 |
EGRESS NEXT MISS |
Egress VLAN table miss. Check the |
131 |
MPLS TTL ZERO |
There might be a forwarding loop. |
132 |
UPF DOWNLINK PDR MISS |
Missing downlink PDR rule for the UE. Check UP4 flows. |
133 |
UPF UPLINK PDR MISS |
Missing uplink PDR rule. Check UP4 flows. |
134 |
UPF FAR MISS |
Missing FAR rule. Check UP4 flows. |
150 |
UPF UPLINK RECIRC DENY |
Missing rules for UE-to-UE communication. |